.png)
.png)


This blog describes a new monitoring solution for SAP PO that is based on Elasticsearch and Kibana. The combining power of those two solutions provides many valuable features that are not available with the standard SAP PO monitoring.
Elasticsearch is a search engine based on the Lucene library. It provides a distributed, multitenant-capable full-text search engine with an HTTP web interface and schema-free JSON documents.
Kibana is an open source data visualization plugin for Elasticsearch. It provides visualization capabilities on top of the content indexed on an Elasticsearch cluster. Users can create bar, line and scatter plots, or pie charts and maps on top of large volumes of data.
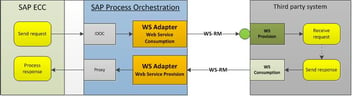
Architecture
Both header data and payload data are extracted from SAP PO by an dedicated agent running on the PO system. The agent handles the complex steps of ingesting data into Elasticsearch like collecting, converting and mapping to the Elasticsearch index
A dedicated Kibana plugin provides the user interface for the end user. The end user does not need to have Elasticsearch expertise to use the Monitoring tool.

The Monitoring solution
The daily dashboard provides the status of the interfaces for the last 24 hours.

The Settings page enables the end user to configure the Monitoring solution.

Predefined fields.
A common dictionary is defined for all predefined fields. By having a common set of predefined fields, the end user can search across interfaces, for example search across all interfaces based a specific SAP customer number. For each interface, the predefined field is map to a specific element of the payload.

Map the predefined to a specific element of the payload.

Message Monitoring provides the status for the interfaces. A text search looks for any occurrences of a particular value across all interfaces. An advanced search with predefined fields limits the results to interfaces for which the predefined fields are mapped.

Powerful free text search across all interfaces. The search below returns all interfaces that have the value 1000004096 in the payloads.

Advanced search with context using the predefined fields .The search below is across all interfaces that have plant equals to 5083 OR customer number equals to 1000004096.

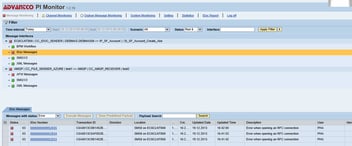
Channel Monitoring provides the status of the PO channels.

Powerful dashboard based on the imported data. The example below shows a dashboard for service orders send thru SAP PO to different plants.

Conclusion
The combination of Elasticsearch and Kibana provides powerful features that enhance the monitoring of SAP PO on levels that are not possible with the standard SAP PO Monitoring.
Sources: